Data VisualizationResearchAugust 2018
Visualizing State/County Migration
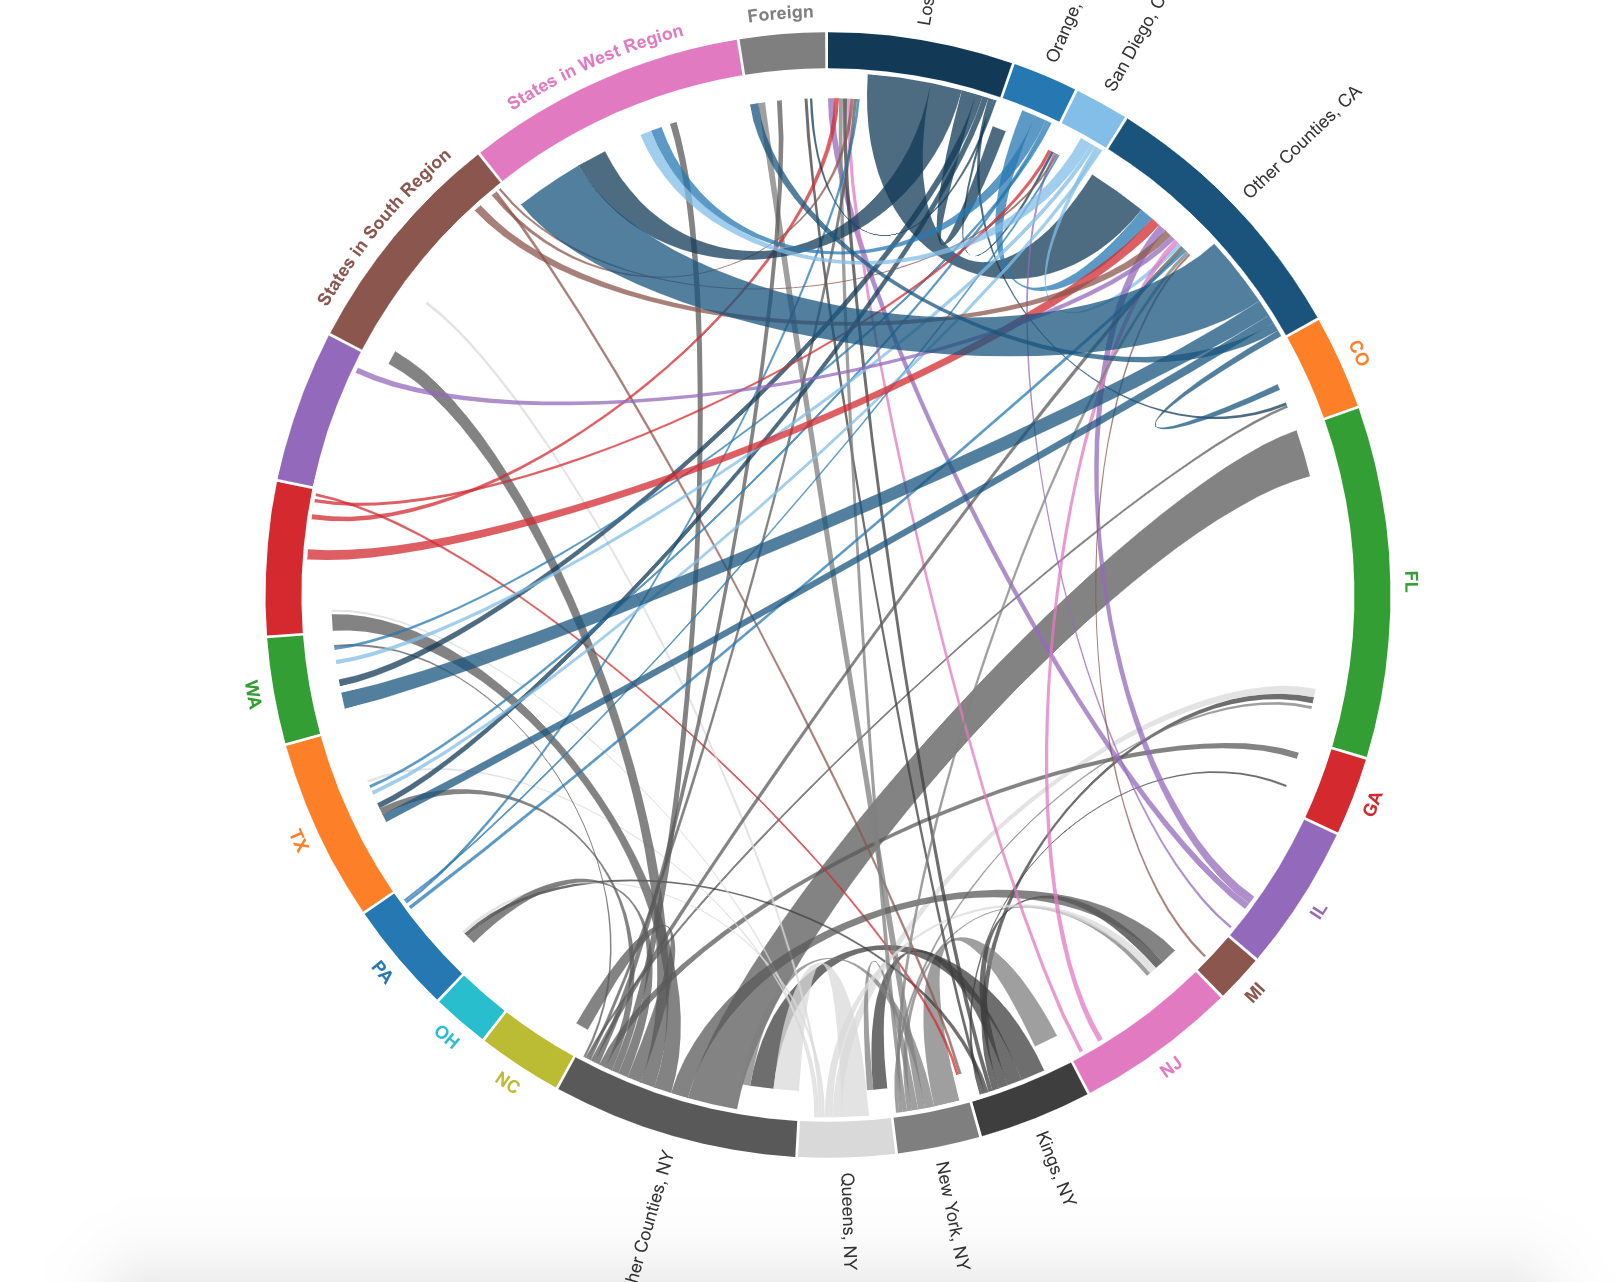
Circular Migration Plot
A working version of the US migration patters is available here: https://arash2060.github.io/State-County-migration/
I used the original D3.js plot which created interactive chord diagrams like those here http://www.global-migration.info/ and http://www.german-migration.info/.
Extension in Python:
Data cleanup, aggregation of small counties and states, and net migration patterns were done in Python.
More details to come …
In the meanwhile, see my github repository for more info.